This Options Metric Hit an Extreme Level During the Recent Rally
According to one measure of skew in the options market, investor complacency hit a historically elevated level during the recent rally
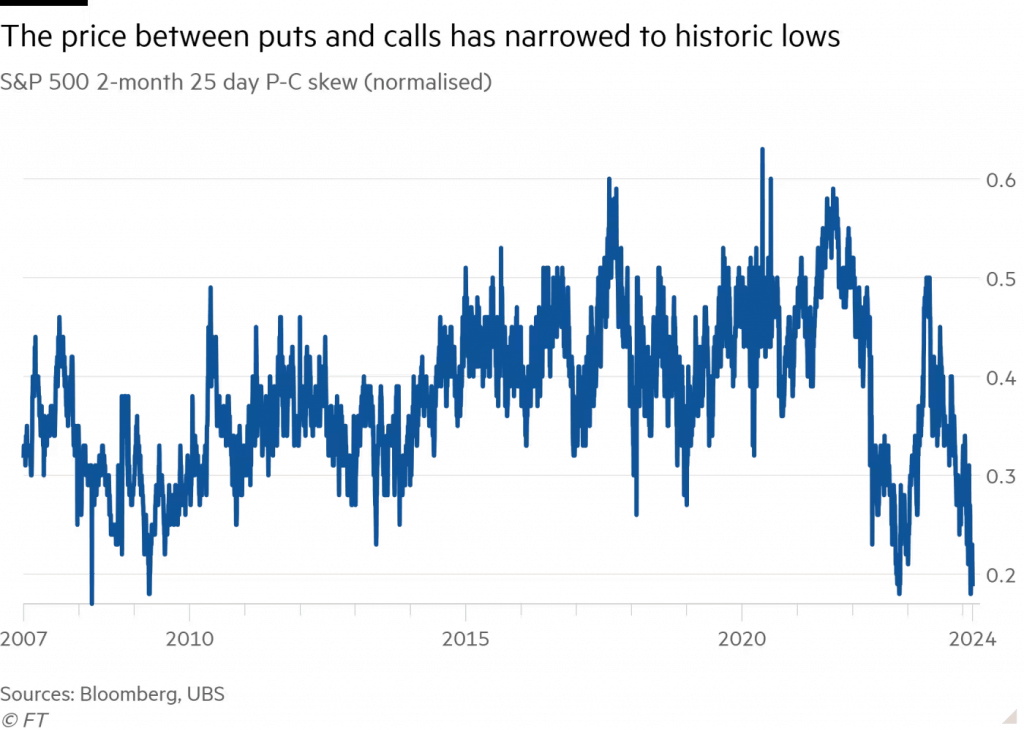
- In March, the put-call skew in the S&P 500 options market dropped to historically low levels, indicating that investors had gotten extremely complacent during the recent stock market rally.
- Underscoring that reality, the VIX and VVIX are both trading at the lower end of their long-term ranges, despite the recent pullback in the major stock market indices.
- The mean reversion principle suggests that this level of complacency can’t last forever, and that in time, “fear” in the financial markets will eventually trend back toward its long-term average.
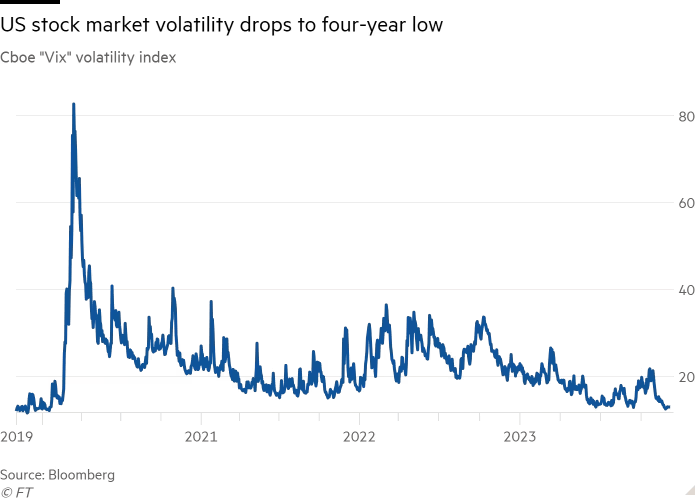
The S&P 500 has corrected by about 5% since peaking around 5,260 in April. But despite recent volatility in the stock market, the CBOE Volatility Index (VIX) is still trading well below its long-term average of 19.
As of early May, the VIX trades for about 14. But if the major stock market indexes continue to weaken, the VIX could finally break out of its six-month slumber. The VIX (aka “fear gauge”) has been trading in complacent fashion since early November last year when the current rally first took flight.
The VIX is an important indicator of market sentiment, but it isn’t the only one. The U.S. dollar has been increasingly referenced as a gauge of risk in the markets, as well. And in the volatility realm, options market participants also track the CBOE VIX Volatility Index (VVIX) and a variety of metrics related to volatility skew.
In the options universe, the term “volatility skew” refers to the uneven distribution of implied volatility across different strike prices and expiration dates of options contracts. Typically, options markets are skewed negatively, which means downside puts trade with higher levels of implied volatility (aka higher prices) than upside calls.
This structure is primarily due to supply and demand in the options marketplace. Downside puts typically enjoy persistently strong demand, because many market participants use them to hedge against corrections. On the other hand, upside calls are often sold to generate income, as part of the well-known covered call strategy. These natural market forces contribute to negative skew.
That said, skew is by no means static—it shifts over time. For example, amid a sharp correction, skew may steepen, becoming even more negative. This may be attributable to a sharp spike in the demand for downside puts. But skew can also shift in the other direction, becoming more neutral, or even positive.
When skew shifts from negative to neutral, a lower premium is placed on downside puts. This usually occurs when investors and traders become more complacent. And in this environment, the prices of upside calls and downside puts often converge, leading to more symmetrical pricing across the options market. Interestingly, a notable shift in skew occurred very recently.
According to the Financial Times, the price of downside puts in the S&P 500 options market were historically inexpensive relative to upside calls. This usually occurs when investors and traders become complacent, and the recent levels of complacency were pushing against levels only observed a couple of times in the last 16 years, as illustrated below.
Waking up to downside risk
The above data indicates that investors and traders have been especially bullish of late and haven’t been overly concerned about the risk of a correction in the stock market. However, that was before the recent pullback in the S&P 500 at the end of April.
In the wake of the recent slide in the stock market, investors and traders are no doubt more cognizant of downside risks. That’s evidenced by an increase in the CBOE Put/Call Ratio, which is another popular metric used to gauge sentiment in the financial markets.
Since bottoming around 0.55 in late April, the CBOE Put/Call Ratio is now trading closer to 0.75. This ratio is calculated by dividing the total number of traded put options by the total number of traded call options. A higher ratio indicates that more puts (bearish bets) are being traded compared to calls (bullish bets), which typically signals an increase in bearish sentiment.
Importantly, however, the VIX remains below 19—its long-term average—and it’s likely that indicates most investors and traders believe the current bull market narrative is still intact. Whether that holds true is anyone’s guess.
At some point, however, it’s virtually assured that the VIX will climb back toward (or above) its long-term average. This is due to the principle of mean reversion—a fundamental concept in finance—which describes how price levels and volatility tend to return to their historical averages over time.
Mean reversion is based on the premise that extreme fluctuations in market data, whether high or low, are temporary and will eventually move back towards the mean or average. This tendency is often observed after periods of unusual calm or extreme volatility in the markets—indicating that such extremes aren’t sustainable over the long run.
In addition to the gauges of market sentiment (VIX, skew, put/call ratio), market participants can also track the CBOE VIX Volatility Index (VVIX), which is often referred to as the “VIX of VIX.”
VIX uses the implied volatility of options in the S&P 500. As implied volatility rises in S&P 500 options, so does the VIX. Alternatively, the VVIX uses the implied volatility of options in the VIX itself. So as implied volatility rises in the VIX, so does the VVIX, on average.
This is why the VVIX is said to be the “VIX of VIX,” measuring the “volatility of volatility.” Practically speaking, the VIX gauges risk premium in S&P 500 options, whereas the VVIX gauges the risk premium in VIX options. Consequently, VVIX allows for further insight into the prevailing risk dynamic.
For context, the long-term average in the VIX is around 19, while the long-term average in the VVIX is about 90. In spring of 2020, when the stock market dropped precipitously, the VIX set a new all-time closing high above 82 on March 16. On that same day, the VVIX spiked above 200, also setting a new all-time closing high, as illustrated below.
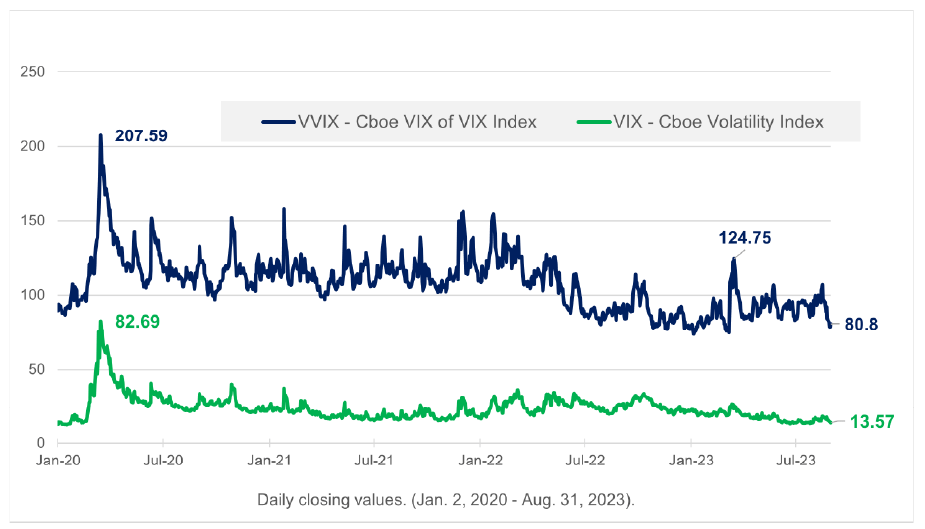
On Oct. 5, 2017, the VIX posted one of its lowest closing prices of all time at 9.19—a clear indication of market complacency. On that same day, the VVIX closed trading just over 91. Today, the VIX trades about 14, while the VVIX trades around 82.
Today’s VIX and VVIX readings both confer a sense of complacency, aligning closely with the recent historical extreme in the 25-day put-call skew in the S&P 500 options market. But it’s important to remember that the only constant in the financial markets is change, and at some point, complacency will evaporate, and be replaced by anxiety. In that environment, it is likely that a myriad of new investing/trading opportunities will materialize.
To learn more about the VIX and VVIX, readers can check out this recent installment of The Skinny on Options on the tastylive financial network. For more background on mean reversion, this episode of The Leap: From Options To Futures is also recommended.
Andrew Prochnow has more than 15 years of experience trading the global financial markets, including 10 years as a professional options trader. Andrew is a frequent contributor of Luckbox Magazine.
For live daily programming, market news and commentary, visit tastylive or the YouTube channels tastylive (for options traders), and tastyliveTrending for stocks, futures, forex & macro.
Trade with a better broker, open a tastytrade account today. tastylive, Inc. and tastytrade, Inc. are separate but affiliated companies.